Forest Conditions
The Forest Conditions pages allow you to dive into the forest types, photos, and graphs and reports generated from 40 forest data plots located in the Research Natural Area in the watershed. The Indicator Dashboard is a good way to monitor large-scale issues, especially once work begins and post-thinning data is collected. Here are a few tips:
-
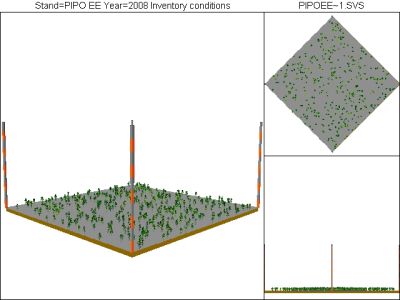
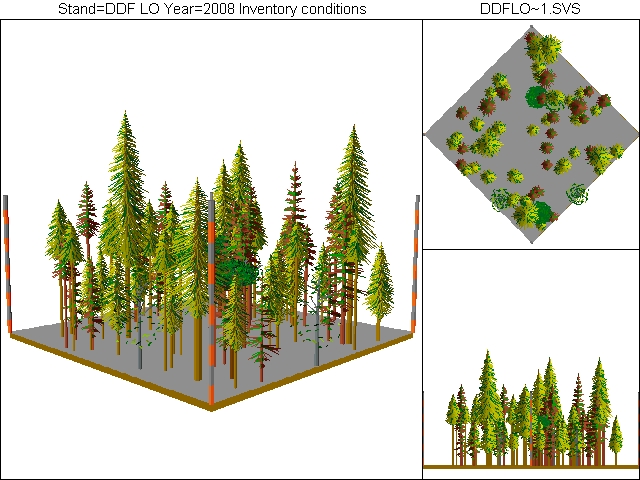
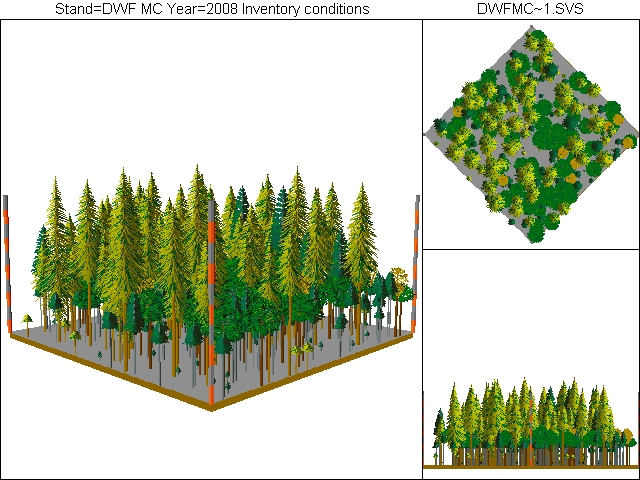
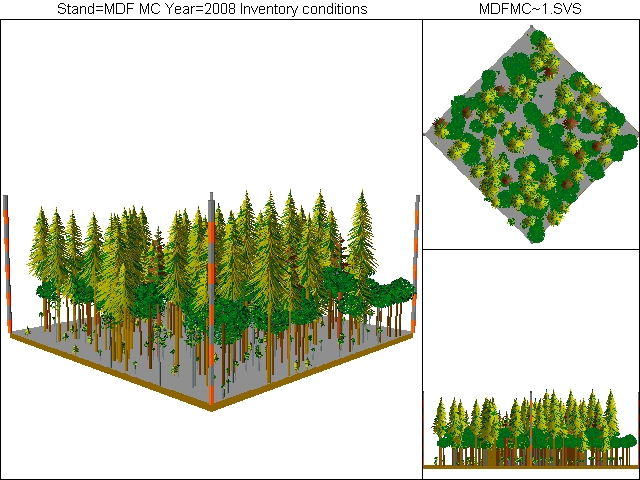
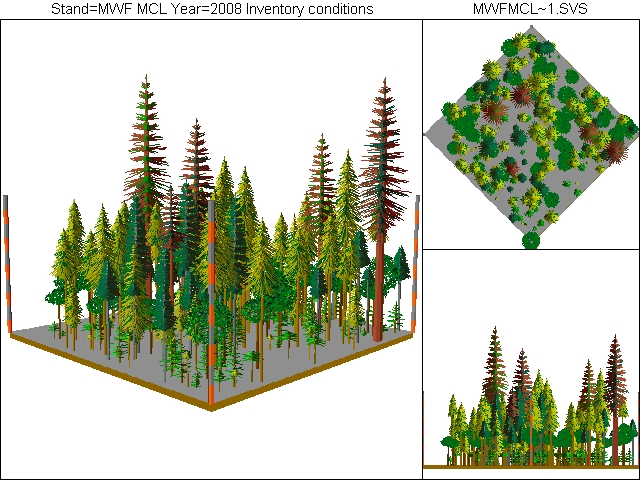
To see what different forest types look like, check out the graphics in the slideshow below. Actual photos will be posted soon.
-
Go deeper by choosing a forest type on the left-hand column and getting specific pictures and graphs for that type.
-
To see all the forest plot data, send a request to chamberc@ashland.or.us. However, this may take a while.
The following graphics are based on plot data taken in the watershed Research Natural Area and visually illustrate a representation of current forest conditions. These graphics characterize an average condition based on a model of multiple plots in that forest type. Graphics will soon be created that show not only the current conditions, but the same forest with proposed prescriptions completed (thinned), and eventually what each (thinned and un-thinned) forest might look like after a wildfire. There will also be specific data summaries available for each forest type, so stay tuned! Click on each graphic to enlarge or start slide show.